
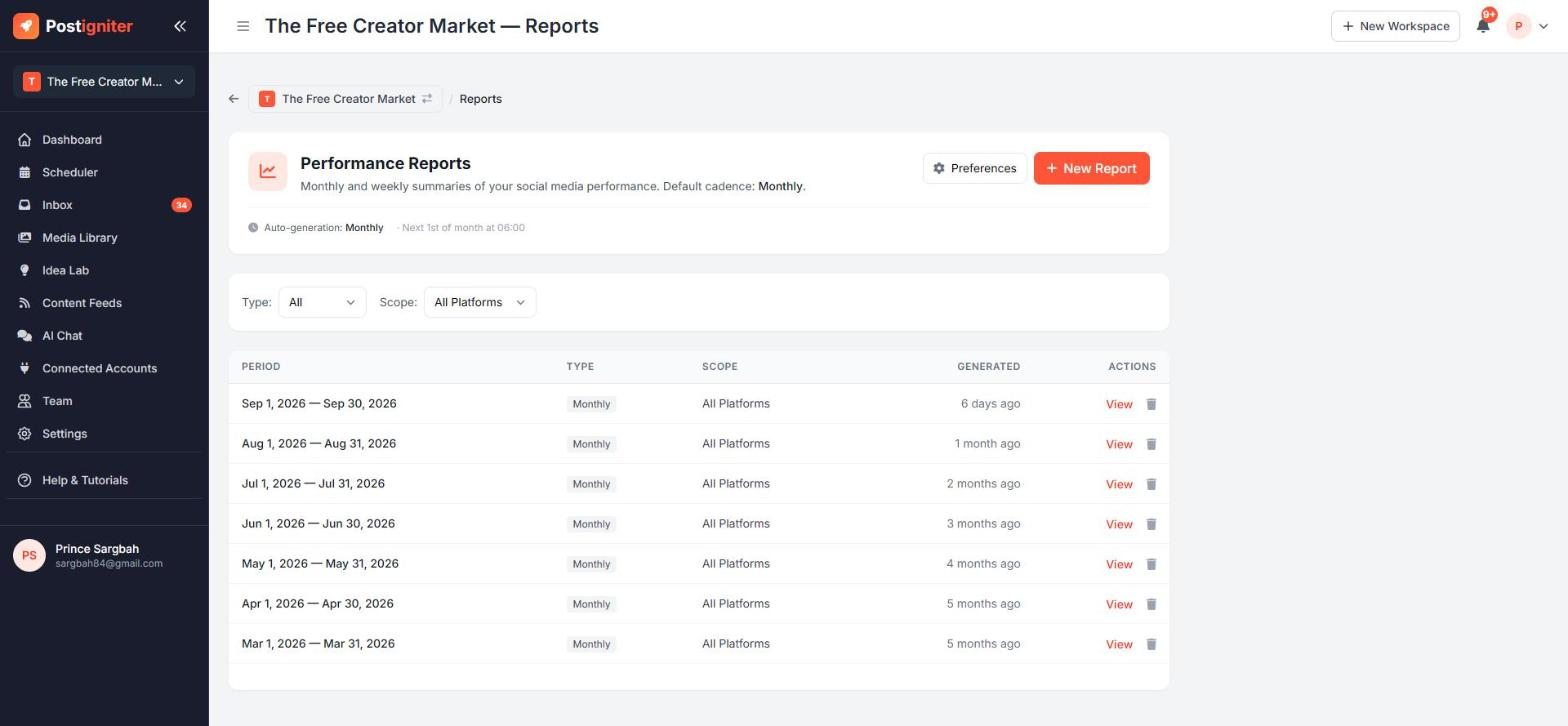
What It Does
Performance Reports summarise how your social media performed over a period. They cover totals across platforms, a section for each platform and your top content. Reports are generated automatically on a schedule, or whenever you need one. You can download them as a PDF or share them with a public link, which makes them ideal for clients and stakeholders.
Open them from ⋮ → Performance Reports on the dashboard, or View full report in the Scheduler.
Creating a Report
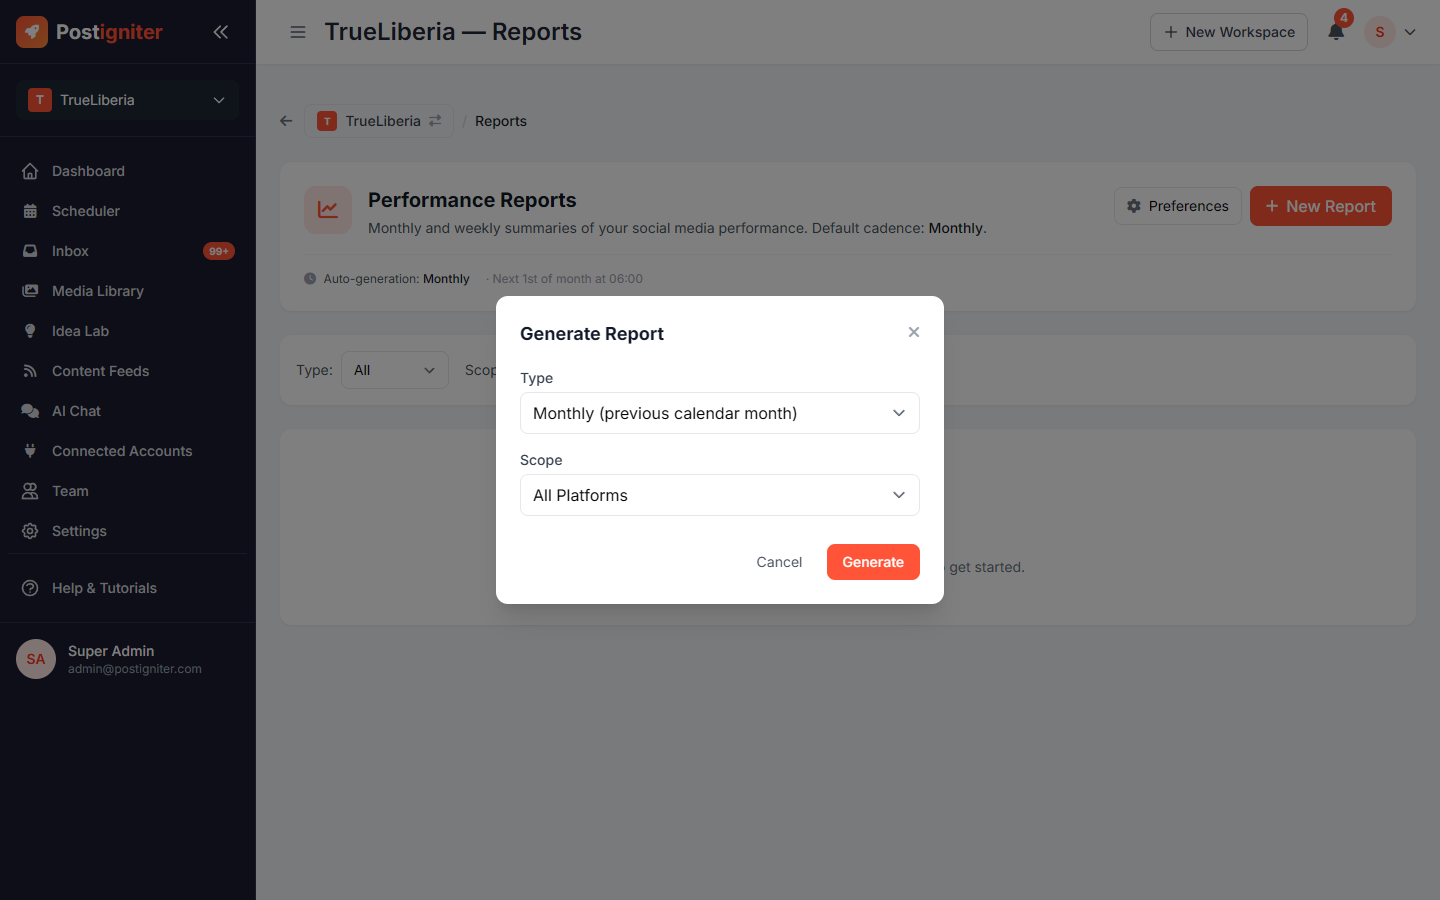
- Click New Report.
- Choose the Type:
- Monthly — the previous calendar month
- Weekly — the previous Monday to Sunday
- Custom — your own date range
- Choose the Scope: all platforms, or a single platform.
- Click Generate.
Reading a Report
Open a report to see:
- Totals across all platforms for the period
- Per-platform sections, each with a stats grid and its top-performing content (click through to see the full post insights)
From the report you can:
- Download PDF — a branded PDF you can email or present
- Share — create a public link anyone can open without logging in. You can switch the link off at any time.
Report Preferences
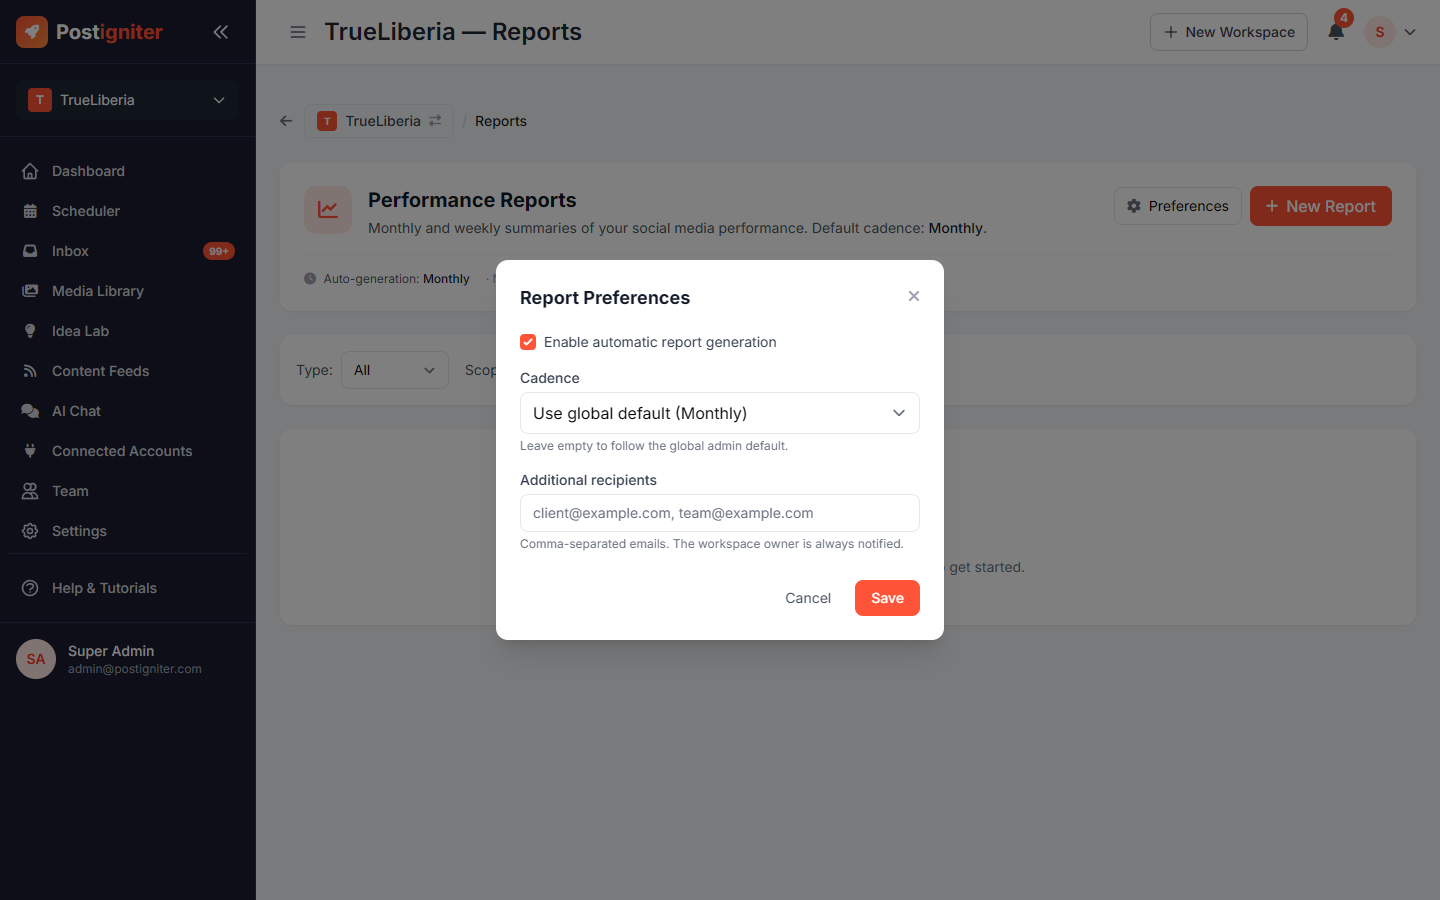
Click Preferences to:
- turn automatic report generation on or off
- choose the cadence:
- Monthly — runs on the 1st at 06:00
- Weekly — runs on Mondays at 06:00
- Disabled
- or follow the global default
- add additional recipients who should receive each new report by email (the workspace owner always gets it)
Tips for Best Results
- Add your client as a recipient so they get each monthly report automatically.
- Use weekly reports while testing a new strategy, then switch back to monthly.
- Compare reports month to month. The per-platform top content is the best guide to what to make more of.