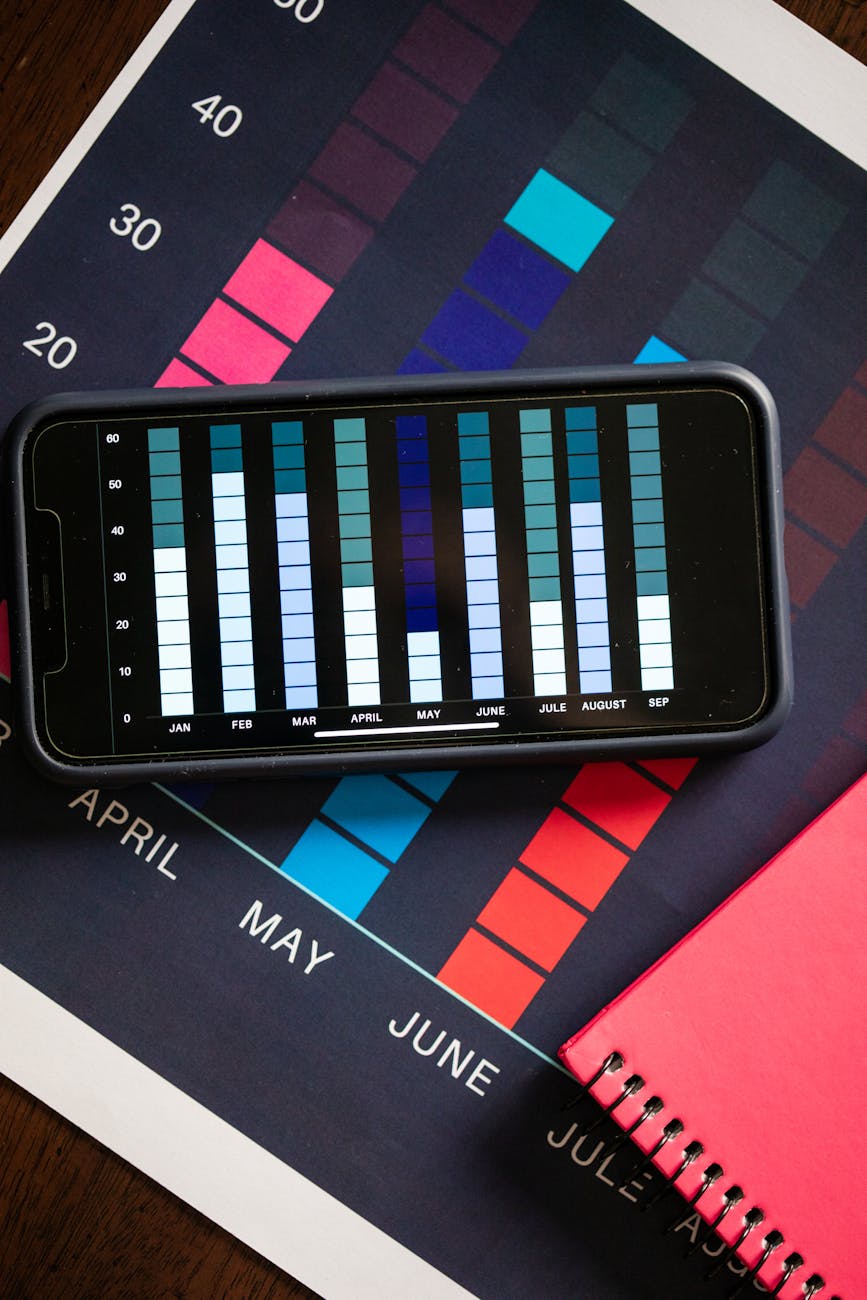
How to Use a YouTube Channel Growth Chart for May 2026
Postigniter Team
May 30, 2026
How to Use a YouTube Channel Growth Chart for May 2026
If you want more views in 2026, guessing is the fastest way to stall. A YouTube channel growth chart gives you a simple, visual way to see what is working, what is fading, and where to double down next. Used correctly, it can turn scattered analytics into a clear growth plan for subscribers, views, watch time, and long-term channel momentum.
In May 2026, the best creators are not just posting more—they are tracking growth patterns across search, browse, suggested videos, and Shorts. That matters because the platform continues to reward channels that understand how YouTube algorithm works rather than chasing vanity metrics. If you have ever wondered about the YouTube algorithm for views, or searched Reddit threads about the latest YouTube algorithm Reddit theories, a growth chart is the practical answer: it shows what your audience actually does, not just what people think the algorithm wants.
What Is a YouTube Channel Growth Chart?
A YouTube channel growth chart is a visual tracker of your channel performance over time. It can be as simple as a spreadsheet or as advanced as a dashboard with weekly data pulls from YouTube Studio. The goal is to monitor trends, spot momentum early, and make decisions based on evidence.
At minimum, your chart should track:
- Subscribers gained per week or month
- Total views and view growth rate
- Watch time hours
- Average view duration
- Impressions click-through rate
- Returning viewers vs. new viewers
- Traffic sources, especially Search, Browse, Suggested, and Shorts feed
Creators in digital marketing, education, and entertainment use growth charts differently, but the principle is the same: measure what moves the channel forward, then repeat the patterns that create compounding growth.
Why a Growth Chart Matters More in 2026
YouTube discovery is more multi-surface than ever. Search still matters, but browse, suggested, Shorts, and session-based recommendations can change a channel overnight. That is why a chart is more valuable than a one-time keyword list or a generic YouTube growth service pitch.
Current creator strategy in 2026 is trending toward:
- Topic clustering instead of isolated videos
- Search-first packaging for educational content
- Shorts-to-long-form funnels to grow returning audiences
- Retention-based scaling using average view duration and audience retention graphs
- Audience fit analysis to identify when a channel is attracting the wrong viewers
A growth chart helps you understand whether you need better topics, better thumbnails, better retention, or a different publishing cadence.
How to Build a YouTube Channel Growth Chart
1. Choose the right time frame
For most creators, weekly tracking is the sweet spot. It is frequent enough to detect patterns, but not so granular that normal fluctuations create confusion. If you publish multiple times a week, add a daily view in the same sheet for short-term packaging experiments.
2. Track the metrics that matter
Do not overload the chart. Start with the metrics that directly connect to growth:
- Views — overall reach
- Watch time — the strongest signal of value
- CTR — how effective your title and thumbnail are
- Average view duration — content quality and pacing
- Subscribers gained — audience conversion
- Traffic source split — how videos are being discovered
If you create educational content, also track search-based views. If you create Shorts, track 1-second view rate and retention curve patterns.
3. Add context notes
This is where most creators improve fastest. Log what changed during each time period:
- Topic type
- Thumbnail style
- Title style
- Video length
- Upload day and time
- External promotion
- Any algorithm or policy changes you noticed in YouTube Studio
Context turns numbers into strategy. For example, if a video about “what is video marketing” outperformed your usual uploads, your chart should help you see whether the win came from topic demand, title clarity, or a better retention curve.
Reading the Chart: What the Trends Mean
When views rise but subscribers do not
This usually means your topic is discoverable but not strongly aligned with your channel promise. In other words, you are getting clicks, but not commitment. Review your titles, intros, and calls to action. Ask whether viewers understand what they will get from your next videos.
When subscribers rise but views stall
This often suggests your core audience likes you, but YouTube is not expanding reach. Focus on packaging, especially click-through rate and topic relevance. It may be time to revisit how to reset YouTube algorithm patterns by broadening topic clusters, not by wiping your channel slate clean. There is no magic reset button, but there is a real strategy: consistently train the system with clearer audience signals.
When watch time improves faster than views
This is a healthy sign. It means your content is becoming more satisfying, even if discovery has not fully scaled yet. A strong watch-time trend often precedes algorithmic growth because YouTube can confidently recommend videos that keep viewers engaged.
When growth spikes from one traffic source
Look closely at whether the spike came from Search, Suggested, Browse, or Shorts. Each source requires a different optimization strategy. Search rewards relevance and intent. Suggested rewards topical adjacency and session continuation. Browse rewards packaging and broad appeal. Shorts reward instant hook strength.
How YouTube Algorithm Works in May 2026
If you want to use a growth chart well, you need a practical understanding of how YouTube algorithm works today. The algorithm is not one single system; it is a set of recommendation systems that try to match the right video to the right viewer at the right moment.
That means YouTube typically tests your video in stages:
- It identifies a likely audience based on topic and viewer history.
- It measures packaging performance through CTR.
- It checks satisfaction signals such as watch time, retention, likes, comments, and session continuation.
- It expands distribution if the video performs well.
Your growth chart helps you see which stage is failing. If impressions are high but CTR is low, the packaging is weak. If CTR is strong but retention is poor, the content promise is not being delivered. If retention is great but impressions are limited, topic selection or audience targeting may be too narrow.
Using Trending Keywords Without Sounding Forced
Even though Google Trends may show unrelated breakout topics like hair growth, the real lesson is that keyword trends can reveal audience curiosity patterns. In YouTube content, you should use trending keywords strategically, not mechanically. That means weaving them into relevant educational content, comparisons, or explanations where they actually fit.
For example, a video about creator analytics might discuss digital marketing, video marketing company workflows, or youtube growth service options as part of a broader channel strategy. It might also explain how to reset YouTube algorithm behavior by improving viewing history signals and content consistency. But do not stuff keywords into titles or descriptions unless they match the viewer’s intent.
Best Practices for a May 2026 Growth Chart
1. Separate Shorts and long-form data
Shorts and long-form content behave differently. Shorts often spike quickly, while long-form videos may grow slowly but deliver stronger subscriber quality. Keep them on separate tabs or sections in your chart so one format does not distort the other.
2. Track topic clusters, not just individual videos
One good video is nice. Three related videos that reinforce each other are better. Track performance by content cluster so you can identify whether a topic pillar is gaining traction. For example, a cluster around “YouTube growth chart,” “YouTube analytics,” and “YouTube channel growth strategy” may produce stronger long-term authority than random uploads.
3. Use rolling averages
Weekly numbers can be noisy. A rolling 4-week average smooths out anomalies and shows the actual direction of your channel. This is especially useful for smaller channels where one viral video can distort the chart.
4. Compare your current data to your baseline
Growth only makes sense relative to your normal performance. If your average CTR is 4.8%, then a 6.2% result is a major win. Your chart should flag improvements against your own baseline, not against unrealistic industry averages.
5. Review the chart after every upload
The best creators do not wait for monthly reports. After each upload, they ask three questions: Did the title and thumbnail earn the click? Did the first 30 seconds hold attention? Did the video create enough satisfaction to earn another session or a subscription?
Where Postigniter Tools Fit Into the Workflow
If you want to turn your chart into action, use tools that speed up execution. For example, once your growth chart shows that search-driven videos perform best, you can use the YouTube Keyword Generator to brainstorm related phrases and niche opportunities. Then use the YouTube Title Generator to create stronger, click-worthy title options for those topics.
After publishing, the YouTube Channel Analyzer can help you review broader channel health and spot patterns that support your growth chart. Together, these tools make it easier to move from data to content decisions without slowing down your publishing system.
Try These Free Tools
- YouTube Title Generator — Create SEO-friendly titles that improve CTR and support stronger growth-chart results.
- YouTube Keyword Generator — Find relevant keyword ideas to build search-first content clusters.
- YouTube Channel Analyzer — Review channel performance patterns and uncover optimization opportunities.
Common Mistakes Creators Make With Growth Charts
- Tracking too many metrics and losing focus
- Changing strategy too quickly after one weak upload
- Ignoring traffic source data
- Mixing Shorts and long-form performance in one trend line
- Judging growth only by views instead of retention and subscribers
- Copying viral trends blindly without checking whether they fit the channel’s audience
A growth chart should clarify decisions, not create anxiety. If a metric does not help you choose your next upload, remove it.
Conclusion
A YouTube channel growth chart is one of the most useful creator tools for May 2026 because it shows you how to grow with precision instead of hope. When you combine it with a clear understanding of what is video marketing, modern YouTube discovery, and audience retention, you can build a channel that scales more predictably over time.
Focus on the metrics that matter, review trends weekly, and use your chart to make smarter decisions about topics, packaging, and publishing cadence. The creators who win in 2026 will not be the ones who guess the algorithm best—they will be the ones who read their data best.
Tags
Postigniter Team
The Postigniter team shares practical tips and strategies to help creators grow their online presence.